

Widget data is limited to the communities assigned to your account. Use View community access in the page banner to see which communities you can analyze.
Key metrics
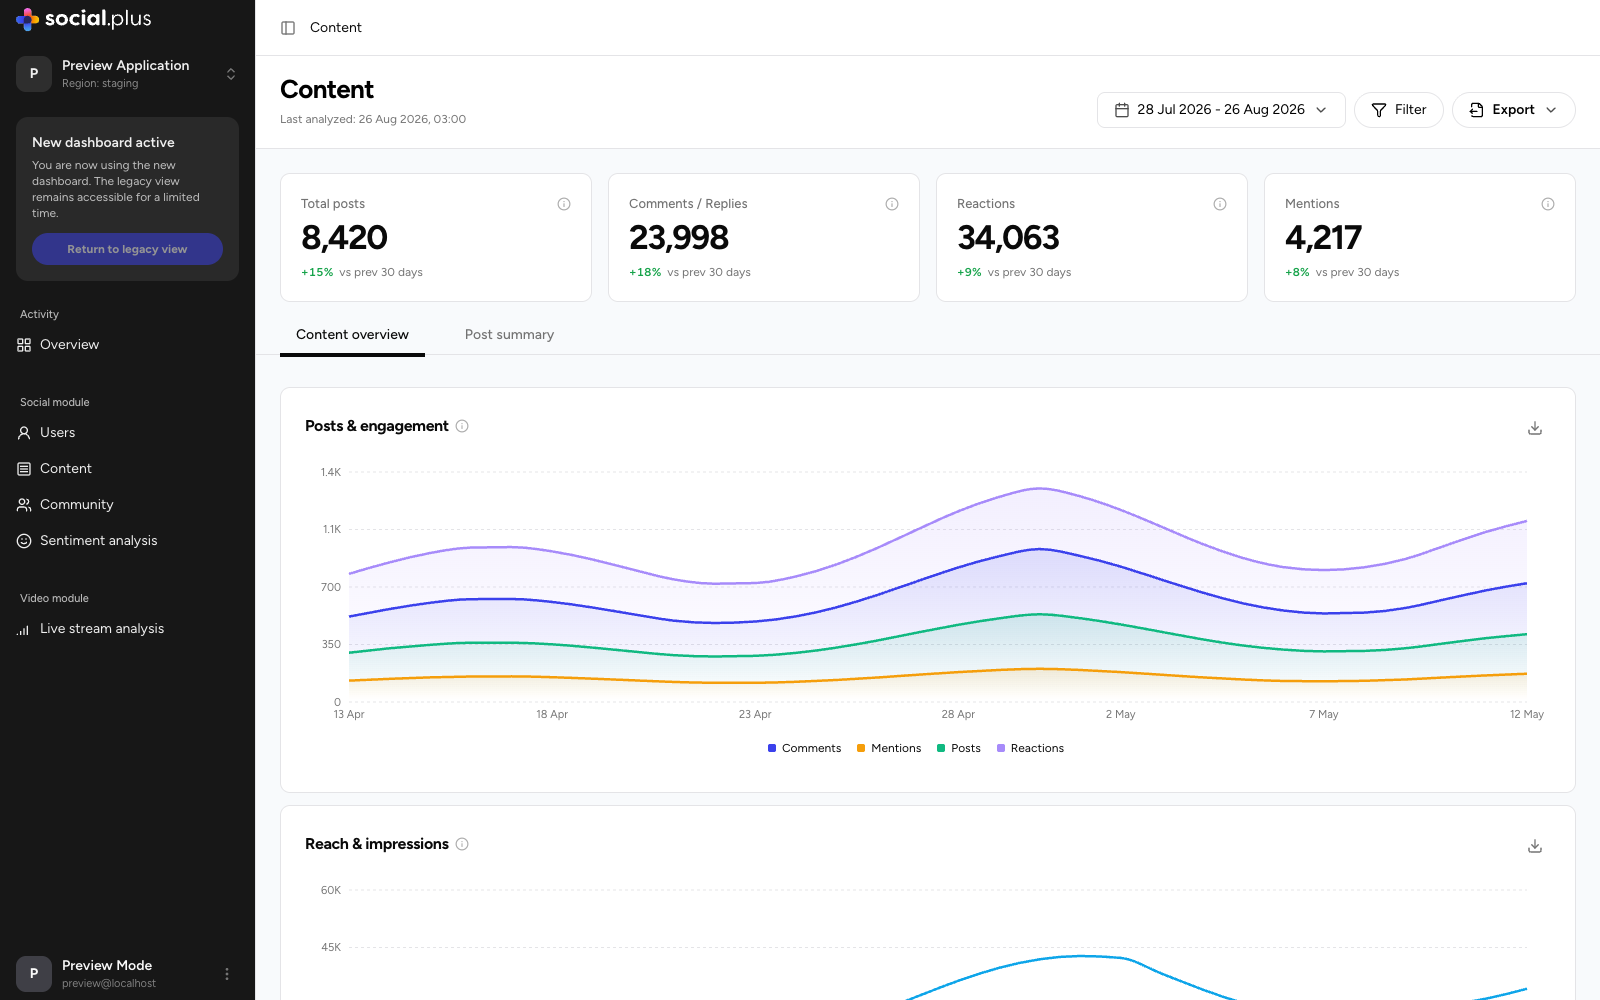
Each card shows the change versus the previous period of equal length.
Filtering
Use Filter to scope the whole page by:- Community — limit metrics to one or more communities.
- User tag — count only content from users with matching tags.
- Role — count only content from users with matching roles.
Content overview tab
Posts & engagement
A daily trend chart with toggleable series for Posts, Comments, Reactions, and Mentions. Use it to see whether engagement (comments, reactions) keeps pace with content volume — engagement growing faster than post count is a sign of a healthy, conversational community.Reach & impressions
Daily Reach (unique users who saw content) and Impressions (total views, including repeats). A widening gap between impressions and reach means the same users are viewing content repeatedly; flat reach with rising post volume means new content isn’t finding new audiences.Engagement by content type
Compares performance across every post format — Text, Image, Video, Poll, File, Live stream, Clip, Audio, and Custom — showing post volume and the engagement each format generates. Switch between Number and Percentage views. Formats with no posts in the selected range are flagged, so gaps in your content mix are easy to spot.Post summary tab
A searchable, sortable table of individual posts published in the period.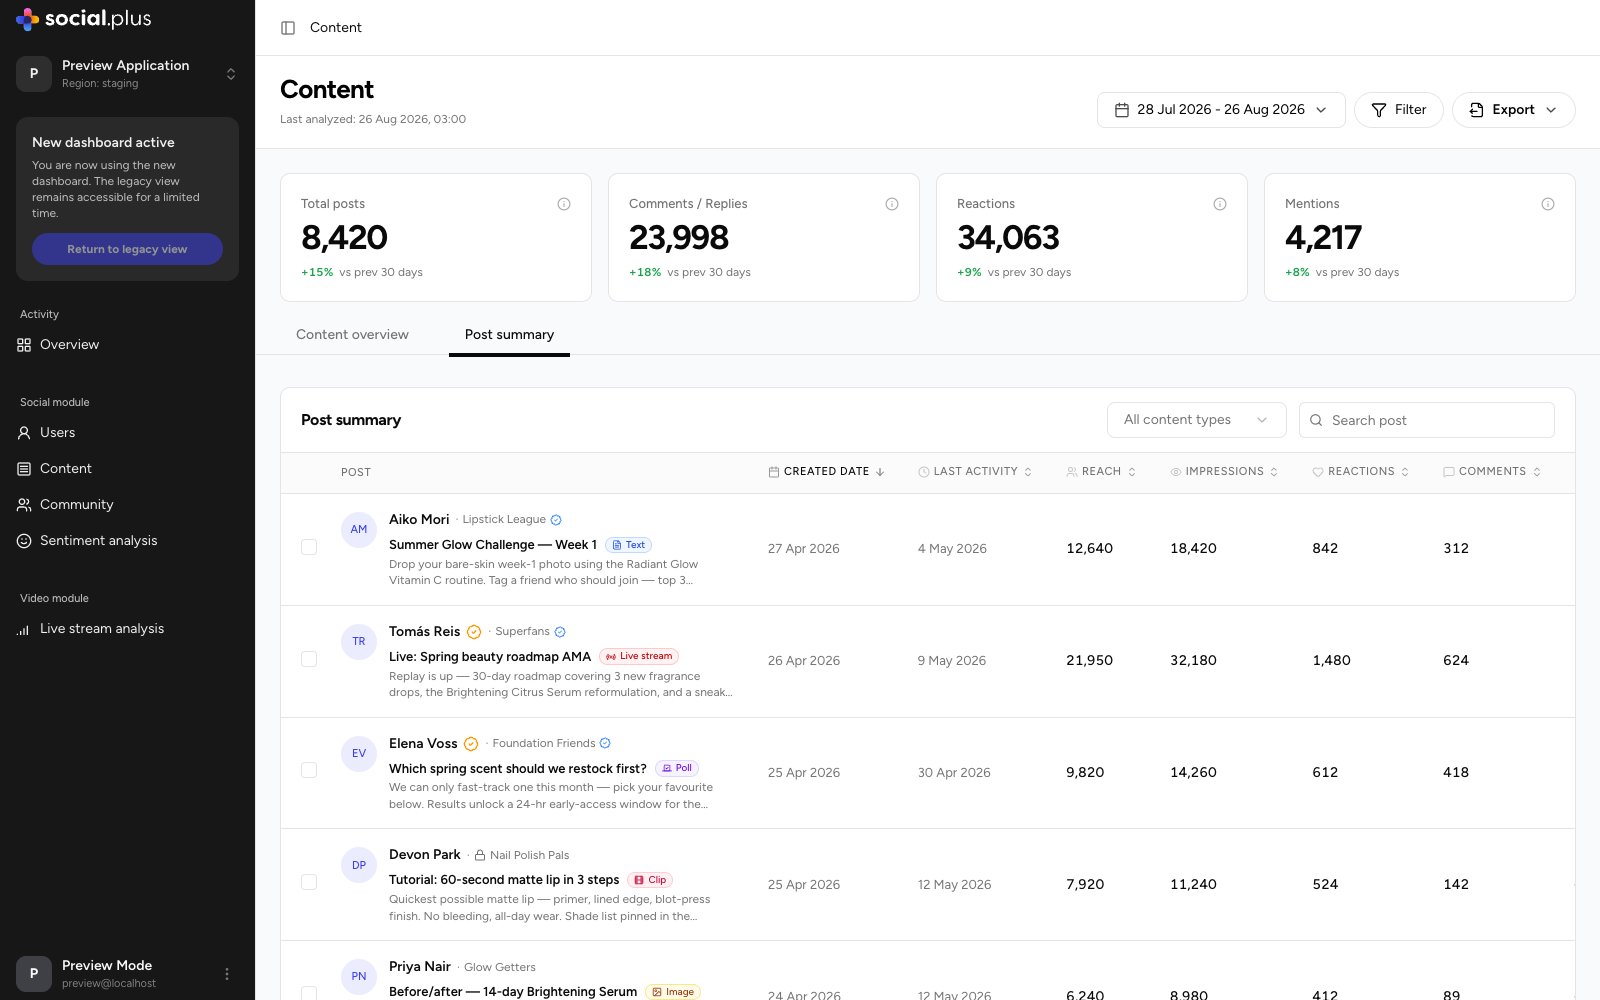
- Created date and Last activity — how long a post keeps generating engagement.
- Reach and Impressions — distribution performance.
- Reactions, Comments, and Flags — engagement and moderation signals.
- Engagement rate — engagement relative to reach, the best single measure for comparing posts of different sizes.
Comparing posts
Use the checkbox on each row to select posts, then select Compare in the bar that appears at the bottom of the table.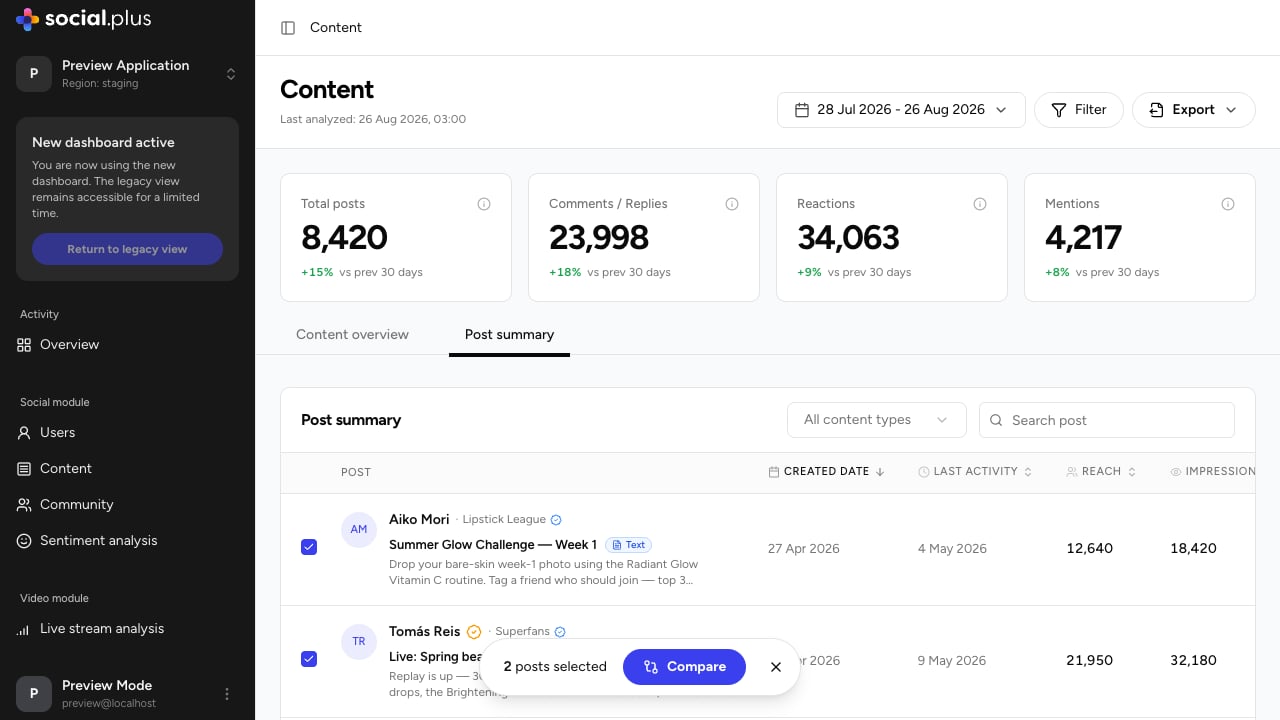
The comparison has its own date-range picker, so you can widen or narrow the window independently of the main page — useful for comparing posts published weeks apart over their full lifetime. Use Clear all to reset the selection and start a new comparison.