Track and analyze the performance of your livestream content with comprehensive analytics. The Livestream Analytics Dashboard provides real-time insights into viewer engagement, watch time, and stream performance metrics.
Overview
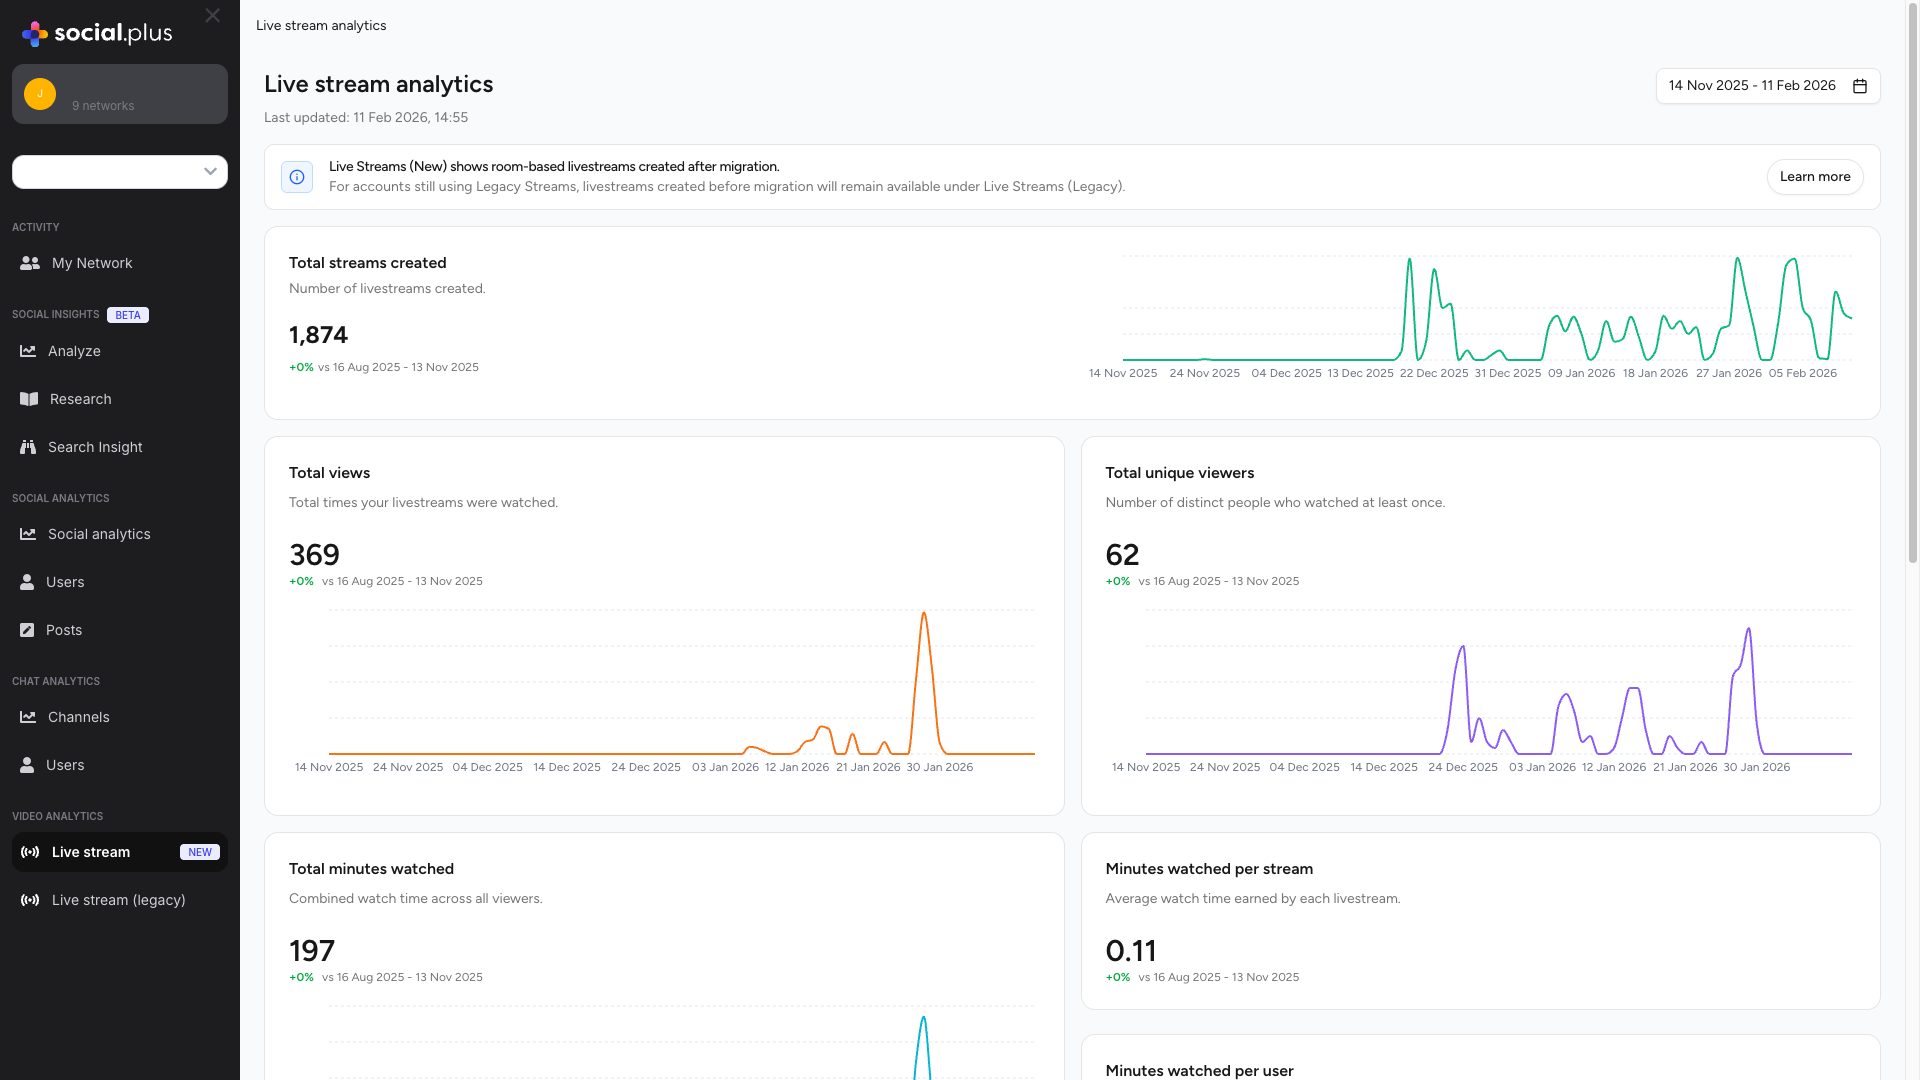
The Livestream Analytics offers a centralized view of all your livestream metrics, helping you understand viewer behavior, content performance, and engagement patterns.Performance Metrics
Track total streams created, views, unique viewers, and watch time with historical comparisons
Engagement Analytics
Monitor viewer engagement with per-stream and per-user watch time metrics
Stream Listings
Browse all livestreams with detailed performance data including views, duration, messages, and reactions
Date Range Analysis
Compare performance across custom date ranges with percentage change indicators
Migration Notice: The new room-based livestreams appear in the Live Streams (New) section, while legacy streams remain available under Live Streams (Legacy) for accounts still using the previous system.
Accessing the Dashboard
Select Live Stream
Click on Live stream (marked with “New” badge) to access the latest analytics dashboard
Key Metrics
Total Streams Created
Metric Overview
Metric Overview
Description: Number of livestreams created during the selected periodDisplays:
- Total count of streams
- Percentage change compared to previous period
- Trend visualization over time
- Monitor content creation frequency
- Identify peak streaming periods
- Track creator activity levels
Understanding the Data
Understanding the Data
This metric helps you understand your streaming cadence and content production rate. A consistent or growing number of streams indicates active creator engagement.Insights:
- High Volume: Strong creator activity and content supply
- Low Volume: May indicate need for creator incentives
- Fluctuating: Seasonal or event-driven patterns
Total Views
Metric Overview
Metric Overview
Description: Total times your livestreams were watched across all streamsCalculation: Sum of all view instances, including repeat views from the same userDisplays:
- Total view count
- Percentage change vs previous period
- Time-series chart showing view trends
- Measure overall content reach
- Assess audience interest levels
- Compare performance across periods
Optimization Tips
Optimization Tips
Increase Views:
- Promote upcoming streams through notifications
- Schedule streams during peak audience hours
- Create compelling stream titles and thumbnails
- Encourage repeat viewing with series content
- Compare views per stream ratio
- Track growth trends month-over-month
- Identify top-performing content types
Total Unique Viewers
Metric Overview
Metric Overview
Description: Number of distinct users who watched at least once during the periodCalculation: Unique user count across all streams, counted once per user regardless of view frequencyKey Differences:
- Total Views: Counts every view instance (repeats included)
- Unique Viewers: Counts each person only once
Audience Analysis
Audience Analysis
Insights from Unique Viewers:High Unique Viewers + Low Total Views:
- Broad reach but low engagement
- Users watching briefly or once
- Consider improving content retention
- Strong loyal audience
- High repeat viewership
- Good content retention
- Healthy expansion
- Good balance of new and returning viewers
Total Minutes Watched
Metric Overview
Metric Overview
Description: Combined watch time across all viewers and streamsCalculation: Sum of all minutes watched by all viewers across all streamsWhy It Matters:
- Primary indicator of content value
- Reflects true engagement depth
- Key metric for monetization and growth
Watch Time Analysis
Watch Time Analysis
Interpreting Watch Time:High Watch Time:
- Engaging, valuable content
- Good stream quality and pacing
- Strong audience retention
- Short stream durations
- Early viewer drop-off
- Content-audience mismatch
- Analyze drop-off points
- Improve content pacing
- Enhance production quality
- Create compelling opening segments
Minutes Watched Per Stream
Metric Overview
Metric Overview
Description: Average watch time earned by each livestreamCalculation:
Total Minutes Watched ÷ Total Streams CreatedBenchmark Values:- < 1 minute: Very low engagement, investigate issues
- 1-5 minutes: Below average, room for improvement
- 5-15 minutes: Good engagement
- > 15 minutes: Excellent engagement
Performance Insights
Performance Insights
What This Tells You:
- Content quality and appeal
- Stream duration effectiveness
- Topic relevance to audience
- Create compelling openings (first 30 seconds critical)
- Maintain consistent pacing
- Deliver value throughout stream
- Use engagement prompts (Q&A, polls)
- Optimize stream length for content type
Minutes Watched Per User
Metric Overview
Metric Overview
Description: Average watch time per individual viewerCalculation:
Total Minutes Watched ÷ Total Unique ViewersInsights:- Individual user engagement level
- Content value perception
- Audience loyalty indicator
Engagement Patterns
Engagement Patterns
High Minutes Per User:
- Loyal, engaged audience
- High-value content
- Strong retention
- Casual viewers
- Discovery/browsing behavior
- Potential targeting issues
- Build community through interaction
- Create consistent streaming schedules
- Develop content series to encourage return visits
- Implement viewer rewards/recognition
- Enhance production quality
All Live Streams Table
The streams table provides detailed performance data for each individual livestream, allowing you to identify top performers and analyze specific content.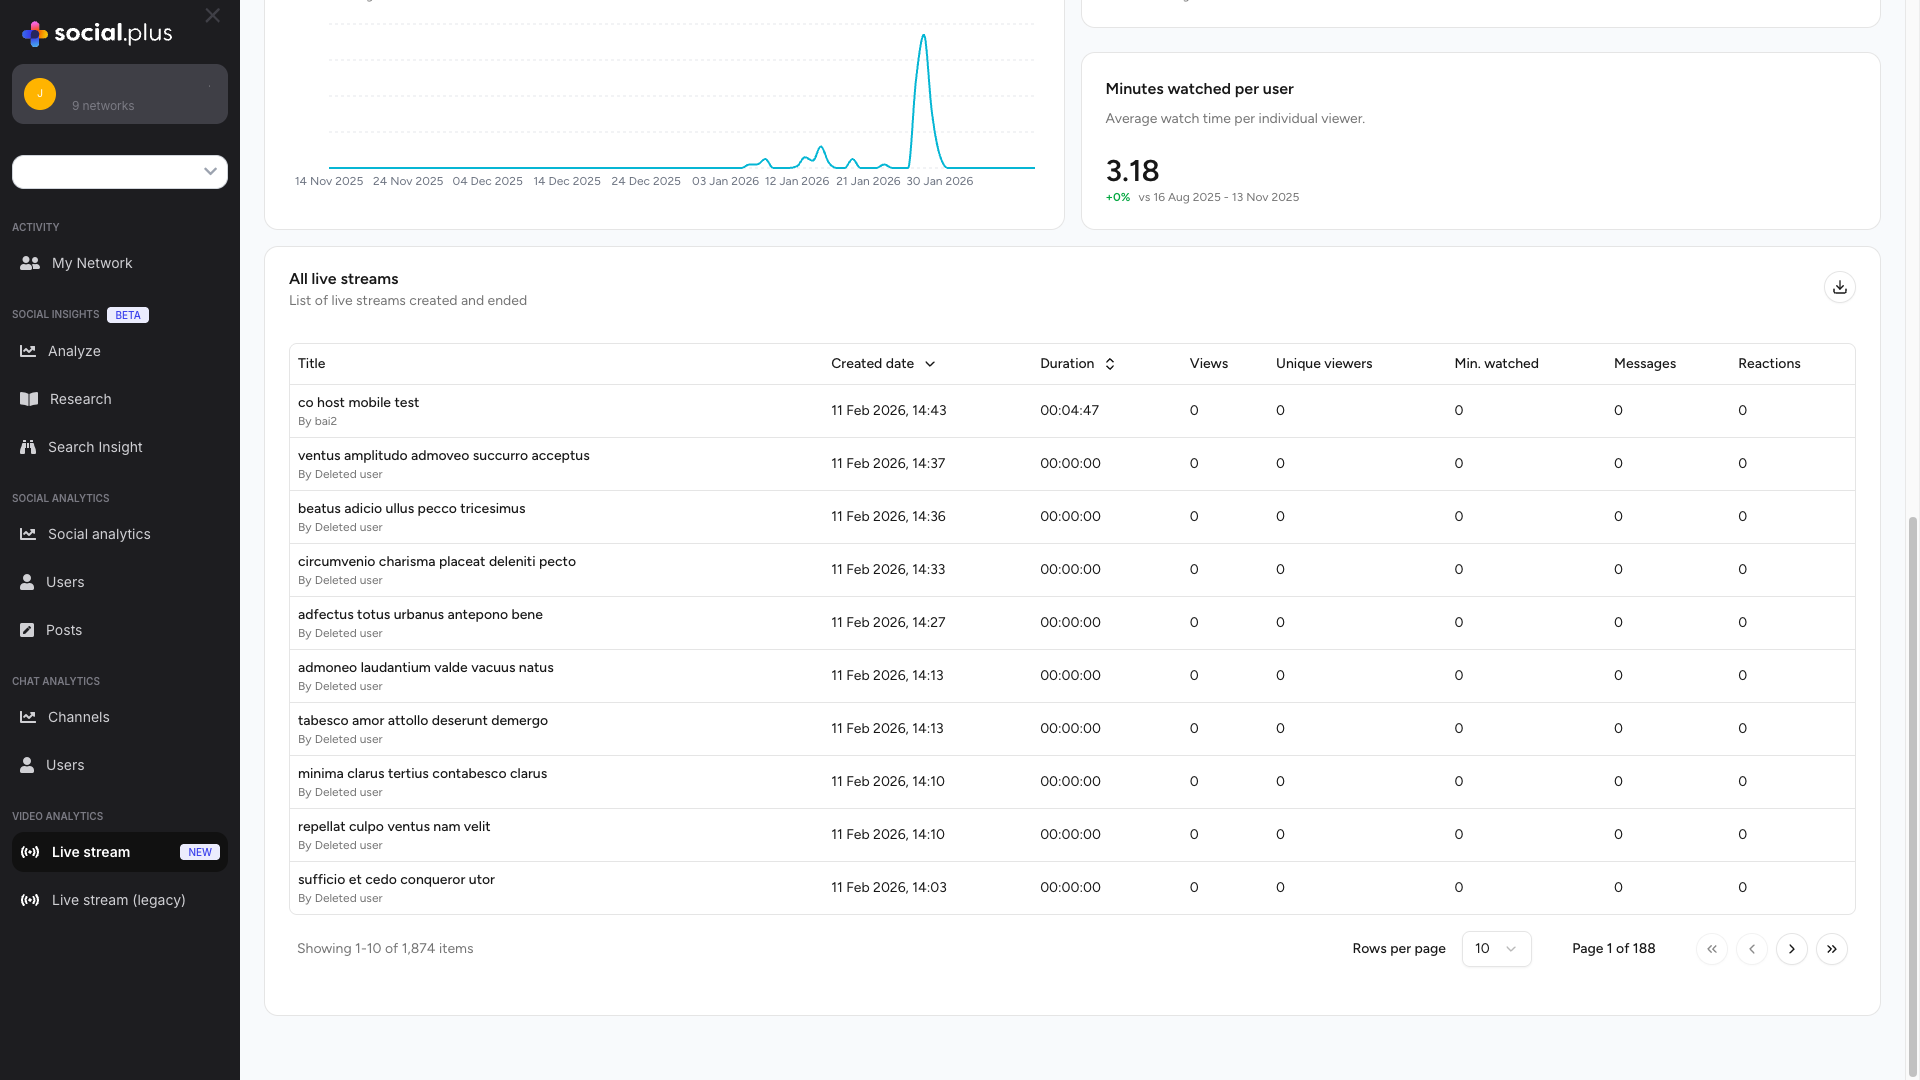
Table Columns
Title
Title
Content: Stream title and creator nameInformation Displayed:
- Stream title (top line)
- Creator name prefixed with “By” (bottom line)
- Identify specific streams
- Track creator-specific performance
- Analyze title effectiveness
Created Date
Created Date
Content: Date and time when stream was createdFormat:
DD MMM YYYY, HH:MM (e.g., “11 Feb 2026, 14:43”)Features:- Sortable column (click header to sort)
- Helps identify recent vs older content
- Useful for time-based analysis
Duration
Duration
Content: Total length of the livestreamFormat:
HH:MM:SS (Hours:Minutes:Seconds)Insights:- Optimal stream length analysis
- Content pacing evaluation
- Correlation with engagement metrics
Views
Views
Content: Total number of times the stream was viewedIncludes:
- Live viewers during broadcast
- Replay/recording views (if enabled)
- Repeated views from same users
Unique Viewers
Unique Viewers
Content: Number of distinct users who watched the streamUsage:
- Measure reach per stream
- Calculate average views per unique viewer
- Identify high-appeal content
Min. Watched
Min. Watched
Content: Total minutes watched for this specific streamCalculation: Sum of watch time from all viewersKey Metric: Indicates overall engagement value of the streamAnalysis: Divide by unique viewers to get average watch time per viewer
Messages
Messages
Content: Number of chat messages sent during the livestreamIndicates:
- Viewer interaction level
- Community engagement
- Real-time conversation activity
- Active, engaged audience
- Interactive content style
- Strong community presence
Reactions
Reactions
Content: Total number of reactions (likes, emojis) during streamEngagement Indicator:
- Quick engagement metric
- Emotional response to content
- Viewer appreciation level
Table Features
Sorting: Click on column headers marked with sort icons to order streams by that metric (ascending or descending)
Row Click: Click on any stream row to view detailed analytics for that specific livestream, including time-series charts and comprehensive stream information
Export: Use the export button (top right of table) to download stream data for external analysis
Date Range Comparison
The dashboard automatically compares your selected period with the equivalent previous period, showing percentage changes for all metrics.Understanding Comparisons
Positive Change (+%):- Metric increased compared to previous period
- Growth in the measured activity
- Metric remained the same
- Consistent performance
- Metric decreased compared to previous period
- Requires investigation if significant
Best Practices
Regular Monitoring
Regular Monitoring
Recommended Review Frequency:
- Daily: For active streaming platforms during campaigns
- Weekly: For regular content creators
- Monthly: For strategic planning and goal setting
- Check percentage changes for significant shifts
- Identify trending streams to replicate success
- Spot issues early (declining metrics)
- Adjust content strategy based on data
Metric Relationships
Metric Relationships
Analyze Metrics Together:Healthy Patterns:
- Growing unique viewers + stable watch time per user
- Increasing streams + proportional view growth
- Rising minutes watched across all metrics
Performance Optimization
Performance Optimization
Data-Driven Improvements:
-
Identify Top Performers
- Sort by minutes watched
- Analyze what makes them successful
- Replicate winning patterns
-
Optimize Timing
- Review created dates of high-performing streams
- Identify best days/times for your audience
- Schedule streams accordingly
-
Content Strategy
- Compare stream titles and topics
- Measure engagement metrics per category
- Focus on high-performing content types
-
Engagement Enhancement
- Streams with high messages/reactions = successful interaction
- Study and replicate engagement techniques
- Build community through consistent interaction
Troubleshooting Low Metrics
Troubleshooting Low Metrics
Low Views/Unique Viewers:
- Improve promotion and discoverability
- Optimize stream titles and descriptions
- Leverage push notifications
- Schedule during peak audience times
- Improve content quality and pacing
- Create compelling openings
- Enhance production value
- Reduce technical issues
- Encourage interaction through prompts
- Ask questions and respond to viewers
- Create interactive content (Q&A, polls)
- Build community culture
Use Cases
Content Performance Analysis
Identify which livestreams resonate most with your audience by comparing views, watch time, and engagement metrics across streams
Creator Insights
Track individual creator performance by filtering the streams table by creator name to understand productivity and engagement
Audience Behavior
Analyze viewer patterns through unique viewer counts vs total views to understand audience loyalty and repeat viewing habits
ROI Measurement
Calculate return on investment for livestream initiatives by tracking engagement metrics against production costs and resources
Content Strategy Planning
Use historical data and trends to plan future content calendars, optimal streaming times, and content themes
Growth Tracking
Monitor platform growth through trending metrics and percentage changes to validate strategy effectiveness
Comparing with Legacy Analytics
For accounts that have migrated from the legacy livestream system, both analytics dashboards remain accessible during the transition period.
Key Differences
| Feature | Live Stream (New) | Live Stream (Legacy) |
|---|---|---|
| Stream Type | Room-based livestreams | Channel-based livestreams |
| Date Coverage | Streams created after migration | Streams created before migration |
| Analytics Depth | Enhanced metrics and visualizations | Standard metrics |
| Real-time Updates | More frequent updates | Standard update frequency |
| Export Options | Enhanced export capabilities | Basic export |
Migration Recommendation: New livestreams should use the room-based system (Live Stream New) to take advantage of improved features and analytics capabilities.
Individual Livestream Analytics
Access comprehensive analytics for individual livestream sessions by clicking on any stream row in the table above. Each detail page includes viewer engagement metrics, chat activity, reactions, and detailed stream information.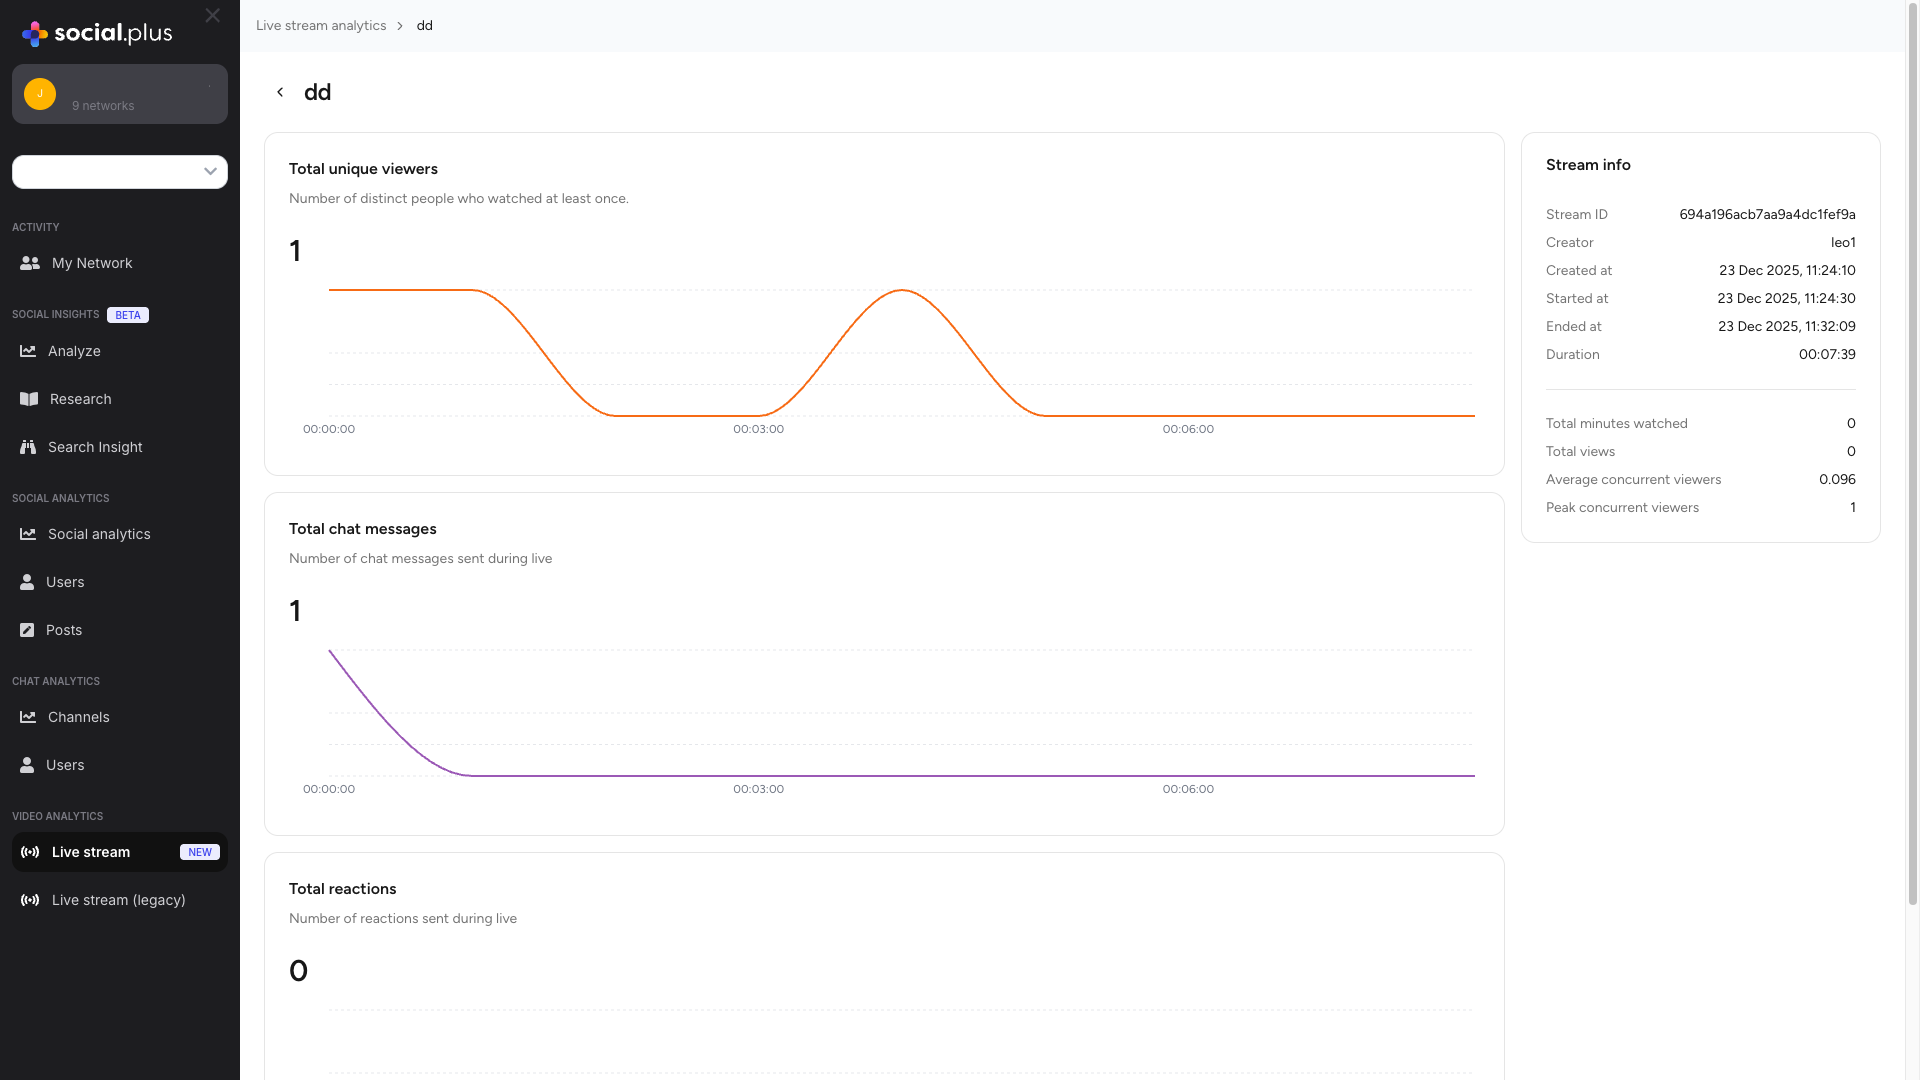
Back Navigation: Use the breadcrumb navigation at the top (Live stream analytics) to return to the overview page.
Detail Page Metrics
Total Unique Viewers
Metric Overview
Metric Overview
Description: Number of distinct people who watched this specific livestream at least onceDisplayed With:
- Total count of unique viewers
- Time-series chart showing viewer count throughout the stream duration
- X-axis: Stream timeline (HH:MM:SS format)
- Y-axis: Number of unique viewers at that moment
- Identify peak viewership moments
- Understand viewer join/drop patterns
- Correlate content with viewership changes
Analyzing Viewer Patterns
Analyzing Viewer Patterns
Time-Series Insights:Steady Growth: Content is discoverable and engaging, viewers staying throughoutEarly Peak, Then Decline: Strong initial interest but retention issuesMid-Stream Peak: Viral moment or notification spikeLate Growth: Word-of-mouth effect or delayed notifications
Total Chat Messages
Metric Overview
Metric Overview
Description: Number of chat messages sent during the livestreamDisplayed With:
- Total message count
- Time-series chart showing message frequency over time
- Visualization of conversation peaks and valleys
- Audience engagement level
- Interactive content effectiveness
- Community participation
Message Pattern Analysis
Message Pattern Analysis
High Message Activity: Engaged, interactive audience with effective community buildingMessage Spikes: Identify what triggered conversation — controversial or exciting moments, Q&A effectivenessLow Message Activity: Passive viewing behavior — opportunity to add interactive elementsOptimization Tips:
- Ask questions to prompt chat
- Acknowledge and respond to messages
- Run polls or interactive segments
Total Reactions
Metric Overview
Metric Overview
Description: Number of reactions (likes, emojis, etc.) sent during the livestreamDisplayed With:
- Total reaction count
- Time-series chart showing reaction frequency
- Visual representation of emotional response moments
Reaction Analysis
Reaction Analysis
Reactions vs Messages Ratio:
- High Reactions, Low Messages: Passive but appreciative audience
- High Both: Very engaged, interactive community
- Low Both: Need to improve engagement strategies
Stream Information
The Stream Info panel provides comprehensive metadata about the livestream session.Basic Information
Basic Information
- Stream ID: Unique alphanumeric identifier (e.g.,
694a196acb7aa9a4dc1fef9a) — useful for API integration and debugging - Creator: Username or display name of the stream creator
Timing Information
Timing Information
- Created At: Timestamp when the livestream was created (format:
DD MMM YYYY, HH:MM:SS) - Started At: Exact timestamp when the livestream began broadcasting
- Ended At: Timestamp when the livestream ended
- Duration: Total length of the livestream (
HH:MM:SS)
Performance Metrics
Performance Metrics
- Total Minutes Watched: Sum of all time spent watching by all viewers
- Total Views: Number of view instances (includes repeat views)
- Average Concurrent Viewers: Average number of viewers watching simultaneously (
Total Viewer-Minutes ÷ Stream Duration) - Peak Concurrent Viewers: Maximum number of viewers watching at the same time — indicates highest engagement moment
Time-Series Chart Analysis
All three engagement metrics display time-series charts showing activity throughout the stream.X-Axis: Time Progression
Shows stream timeline from start (00:00:00) to end. Hover over any point to see exact timestamp and value.
Y-Axis: Value Scale
Number of viewers, messages, or reactions at that moment. Adjusts automatically to data range.
Upward Trend
Upward Trend
Growing engagement throughout stream — content getting more interesting, word-of-mouth sharing, or delayed notifications reaching users.
Downward Trend
Downward Trend
Declining engagement over time — content became repetitive, technical issues, or stream running too long.
Spikes
Spikes
Sudden increases in activity — exciting moments, Q&A segments, or viral sharing. Review content at spike timestamp and replicate tactics.
Flat Line
Flat Line
Consistent, stable engagement — high flat indicates solid audience; low flat suggests room for improvement.
Related Topics
Social Analytics
Comprehensive analytics for posts, communities, and user interactions
Chat Analytics
Detailed metrics for channel and direct message engagement
Activity Analytics
User activity baseline and engagement patterns