Use the Posts dashboard to review every piece of content in your network, take moderation actions, and open the Post Performance panel to inspect per-post engagement over time.
Content Feed
Browse all posts with real-time metrics
Moderation Actions
Flag, delete, or pin posts directly
Post Performance
Drill into impressions, reach, reactions & comments per post
Posts Overview
The Posts page displays the latest posts and comments across your network. Each post card shows the author, target community or content feed, creation date, and inline engagement counters.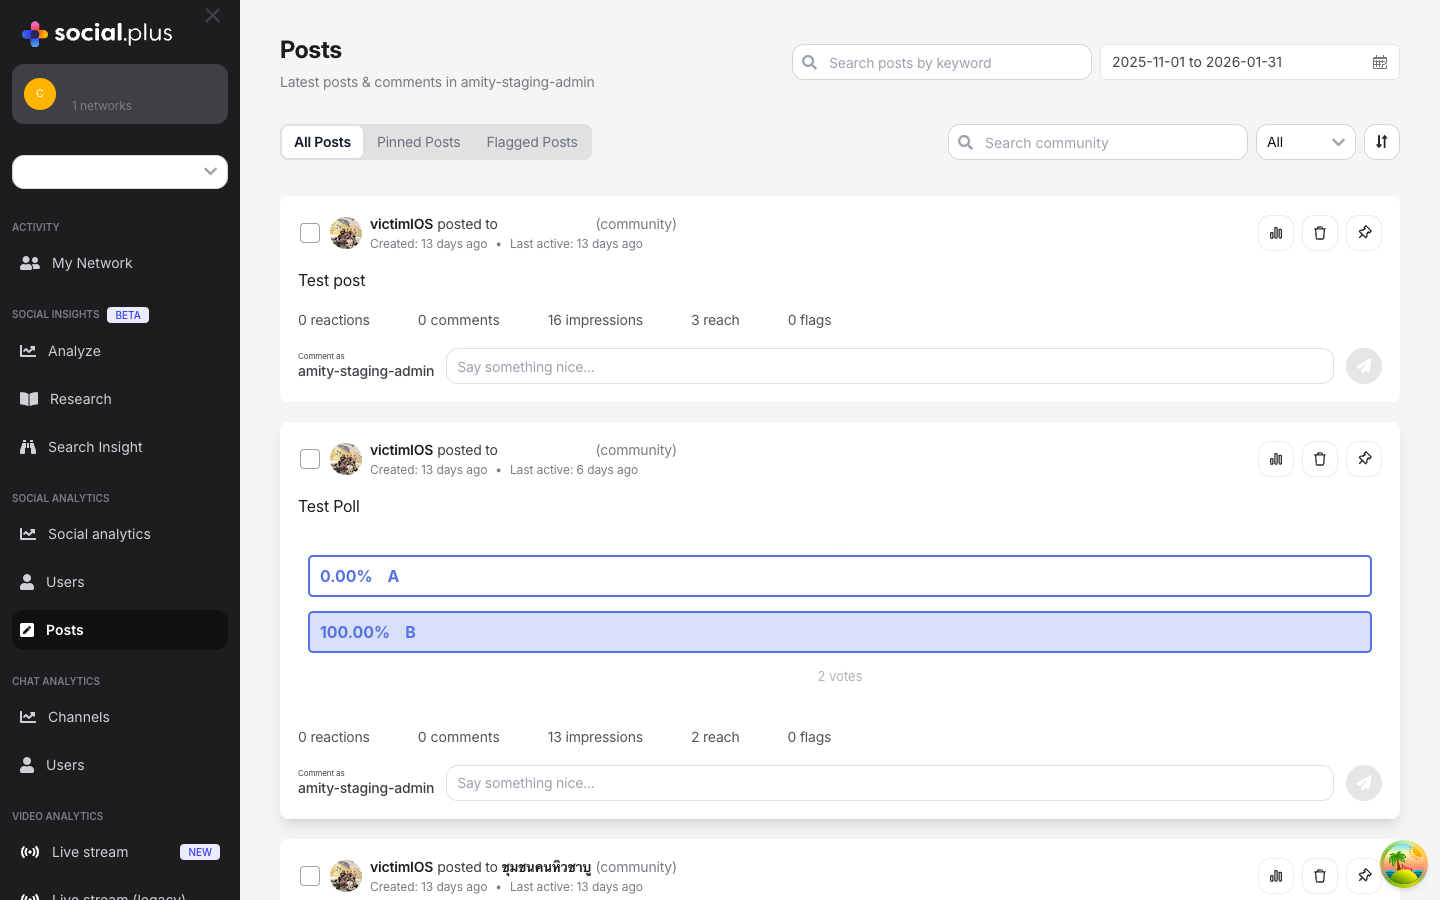
Post Card Anatomy
Each post in the feed includes:| Element | Description |
|---|---|
| Author | Display name of the user who created the post |
| Target | Community or content feed the post belongs to, with type label |
| Timestamps | Created date and last-active date |
| Content Preview | Text, images, video player, or poll results inline |
| Engagement Row | Reactions · Comments · Impressions · Reach · Flags |
| Comment Box | Inline “Comment as admin” field for direct engagement |
| Action Buttons | Post Performance · Delete · Pin (top-right of each card) |
Filtering & Search
Set Date Range
Click the date picker in the top-right corner to select a custom range. Quick presets include Last 7 days, Last 30 days, Last 6 Months, and This year.
Post Tabs
- All Posts
- Pinned Posts
- Flagged Posts
The default view showing every post in your network within the selected date range. Each post displays full content preview with engagement metrics and admin action buttons.
Moderation Actions
Each post card provides three action buttons in the top-right corner:Post Performance
Post Performance
Opens a detailed side panel with per-post engagement charts for Reactions, Comments, Impressions, and Reach over the selected date range. See Post Performance Panel below.
Delete Post
Delete Post
Permanently removes the post and its associated comments from the network. Use with caution—this action cannot be undone.
Pin Post
Pin Post
Pins the post to the top of its community feed, giving it persistent visibility. Unpin by clicking the button again on a pinned post.
Post Performance Panel
Clicking the Post Performance button (bar-chart icon) on any post opens a detailed side panel with time-series charts for that specific post.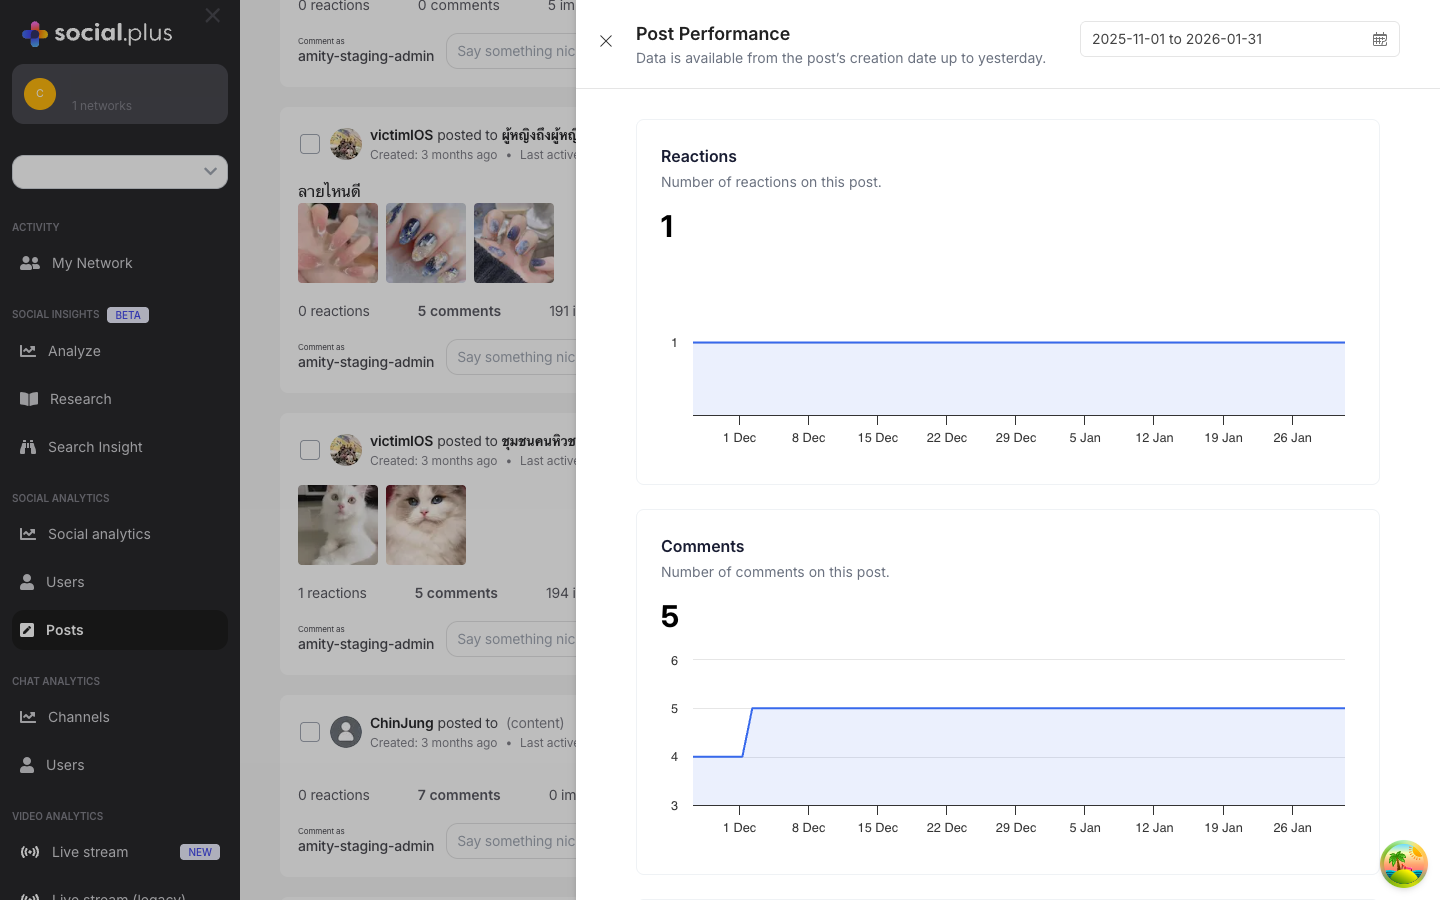
Data is available from the post’s creation date up to yesterday. Today’s data is not yet included.
Performance Metrics
Reactions
Reactions
Definition: Number of reactions (likes, emojis) on this post.Displayed as a daily time-series chart. Use to identify reaction spikes that correlate with distribution events or viral moments.
Comments
Comments
Definition: Number of comments on this post.Tracks comment volume over time. A healthy post typically sees comments taper gradually after an initial burst—flat-lining immediately may indicate low engagement quality.
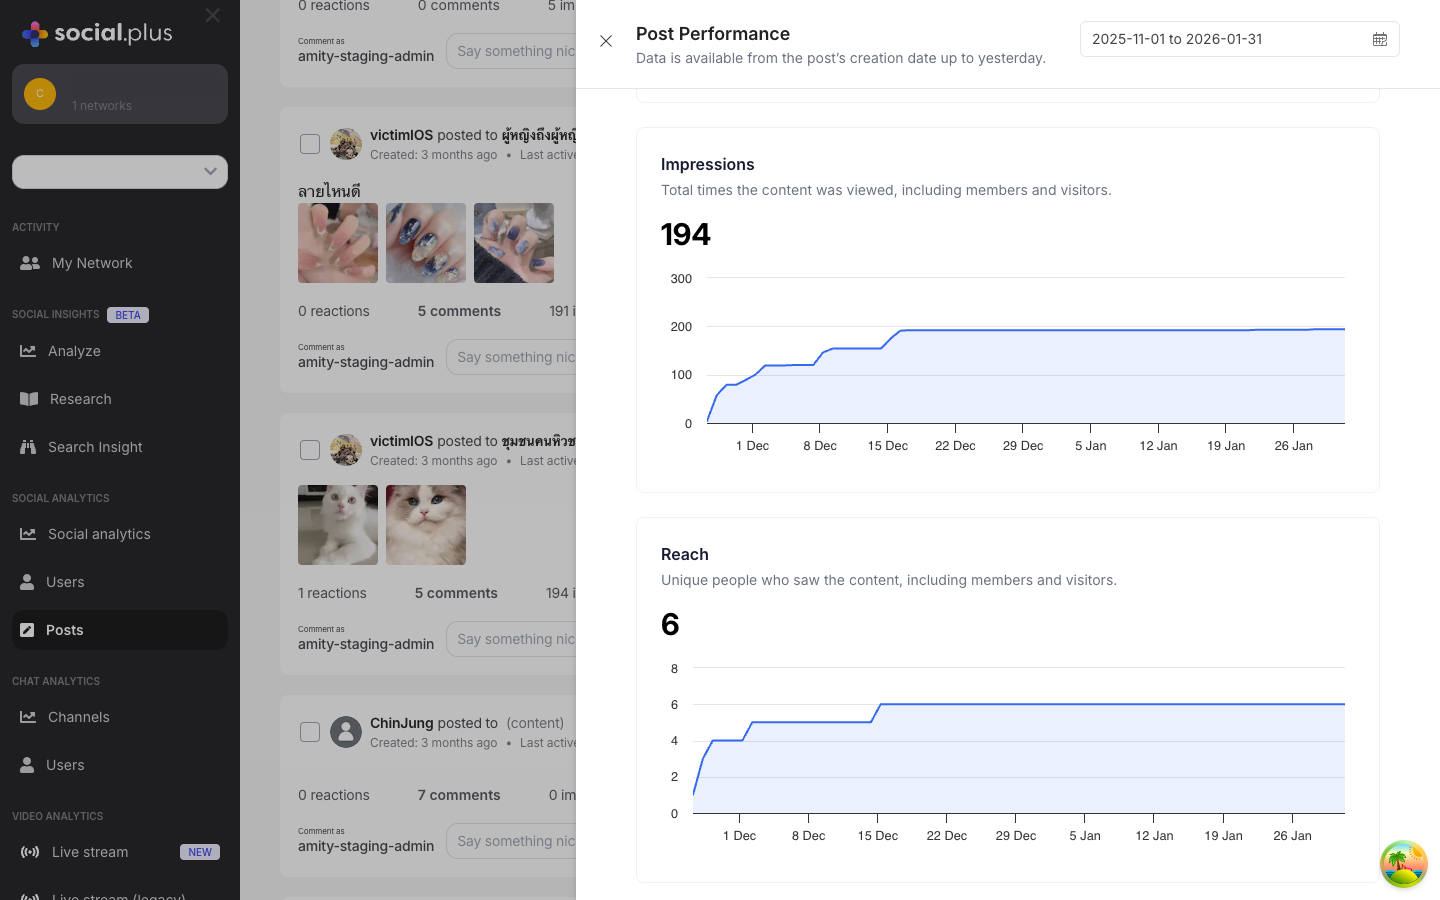
Impressions
Impressions
Definition: Total times the content was viewed, including members and visitors.Measures raw exposure. Compare with Reach to understand whether the same users are seeing the post repeatedly.
Reach
Reach
Definition: Unique people who saw the content, including members and visitors.Reach represents distribution breadth. A high Impressions-to-Reach ratio indicates repeated exposure to the same audience—consider broadening distribution.
Performance Metrics Reference
| Metric | Definition | Why It Matters | Action Trigger |
|---|---|---|---|
| Reactions | Total reactions on the post | Lightweight engagement signal | Zero reactions after 24h of reach |
| Comments | Total comments on the post | Discussion depth indicator | Comments/Impressions ratio below baseline |
| Impressions | Total content renders (members + visitors) | Exposure volume | Flat despite distribution push |
| Reach | Unique viewers (members + visitors) | Distribution breadth | High impressions but stagnant reach |
Best Practices
Daily Moderation Workflow
Daily Moderation Workflow
- Start with the Flagged Posts tab to clear the moderation queue
- Switch to All Posts and scan for anomalies (spam bursts, engagement drops)
- Review Pinned Posts to ensure promoted content is still relevant
- Open Post Performance on key posts to validate distribution health
Using Post Performance Effectively
Using Post Performance Effectively
- Compare Impressions vs Reach to detect audience saturation
- Check Reactions and Comments trends to assess engagement quality
- Adjust the date range to isolate specific campaign periods
- Use the per-post data to inform content strategy decisions
Content Pinning Strategy
Content Pinning Strategy
- Pin announcements, events, or high-quality community content
- Rotate pinned posts regularly to keep feeds fresh
- Limit pinned posts per community to avoid feed clutter
- Monitor pinned post performance to confirm visibility impact
Troubleshooting
| Symptom | Likely Cause | Resolution |
|---|---|---|
| Posts not appearing | Date range too narrow | Expand the date range or reset to “Last 30 days” |
| Metrics show zero | Post is very new | Data is available from creation date up to yesterday—wait 24h |
| Flagged tab empty | No flagged content | Healthy state; continue monitoring |
| Post Performance panel shows “No data” | Post has no engagement in selected range | Adjust the date range to cover the post’s active period |
| Search returns no results | Keyword mismatch | Try broader search terms or clear filters |
Related
Social Analytics
Community-level engagement metrics and growth trends
Activity Analytics
User-level activity and retention KPIs
AI Social Insights
Qualitative topic and sentiment analysis