> ## Documentation Index
> Fetch the complete documentation index at: https://learn.social.plus/llms.txt
> Use this file to discover all available pages before exploring further.
# User & Activity Analytics
> Operational guide to interpret user growth, retention, concurrency, and feature adoption metrics in the Portal dashboard.
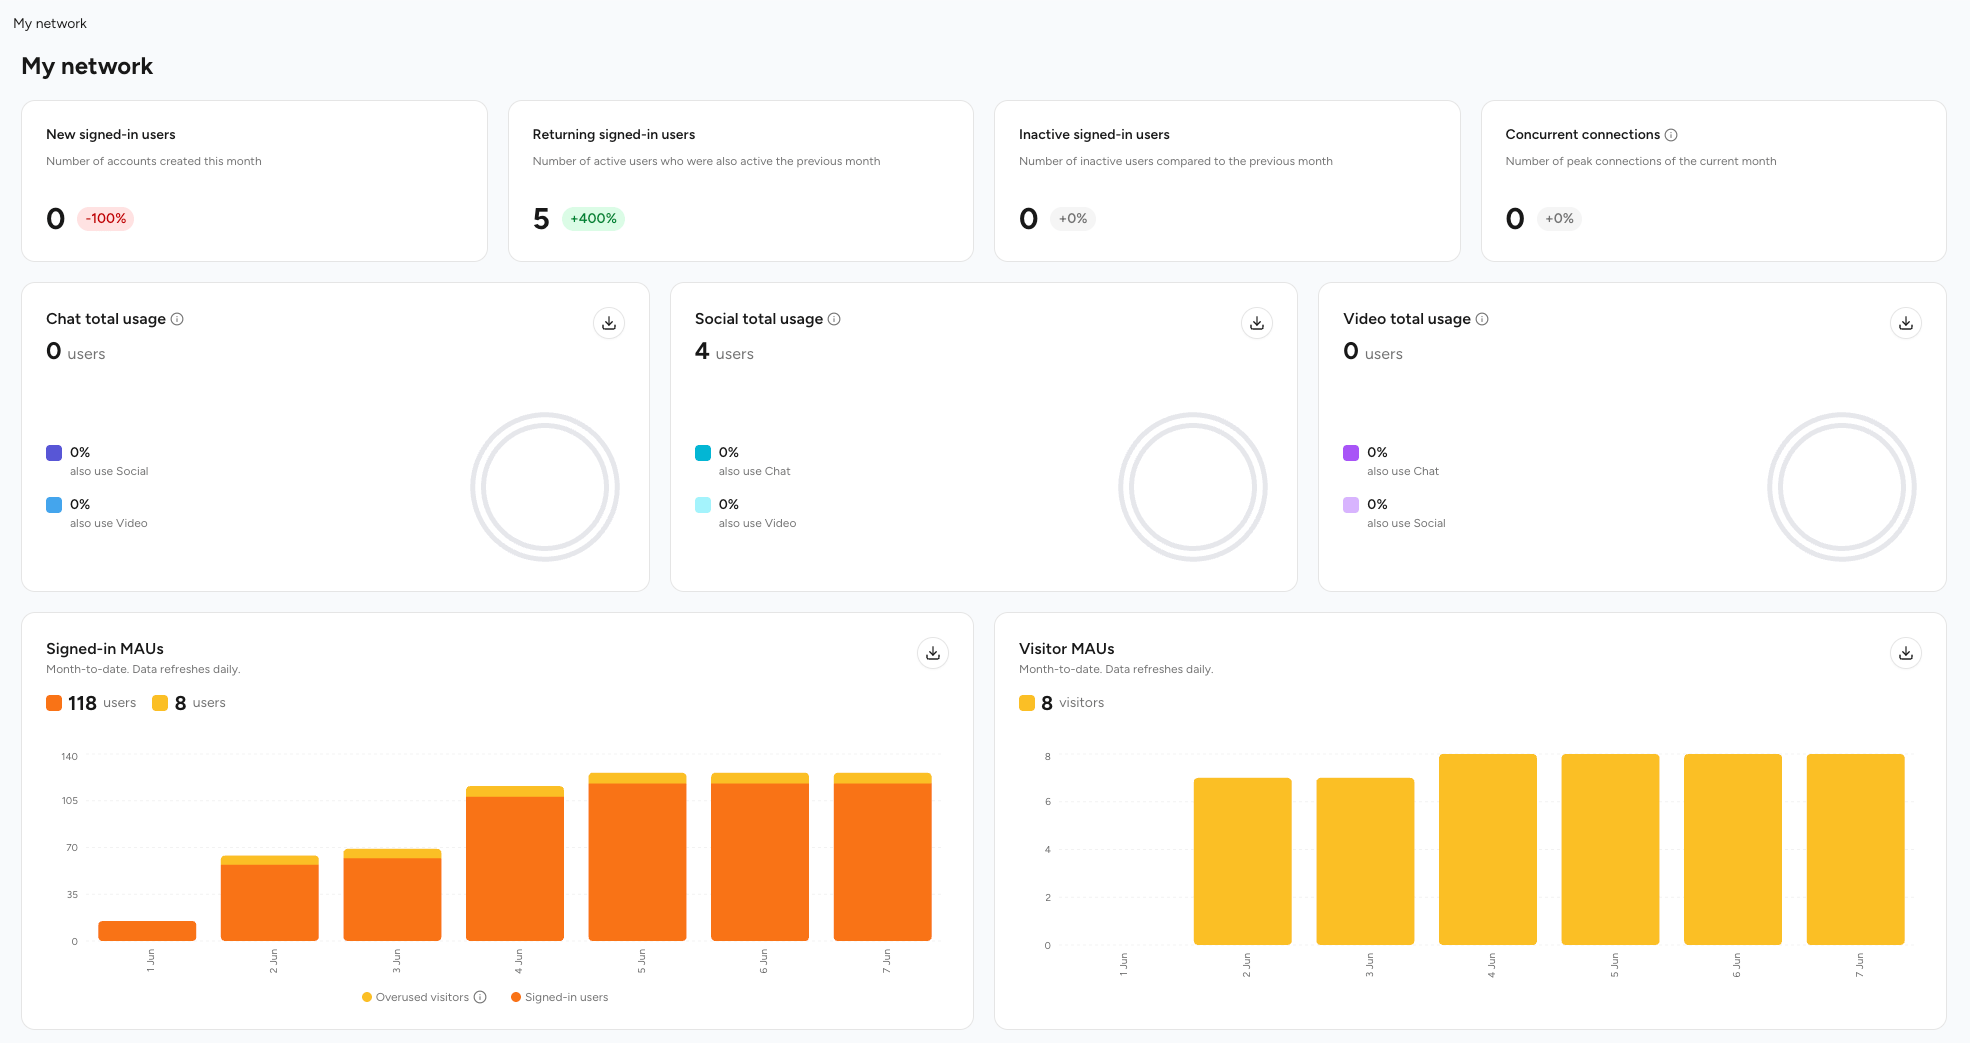
Use this dashboard to monitor acquisition, retention, concurrency load, visitor traffic, and cross-feature adoption so you can prioritize growth levers and capacity planning.
 Track new user inflow
Monitor returning vs inactive
Peak load insights
Cross‑usage patterns
Usage for each module
Identify inactivity early
Track visitor traffic and fair-use reclassification
## KPI Overview (Main View)
Users created in selected period. % delta compares to prior equivalent period. Sudden spikes: evaluate campaign attribution; drops: audit funnel.
Active this period AND prior period. Proxy for retention & stickiness. Track ratio returning / total active.
Previously active but not active this period. Rising trend → trigger re‑engagement campaigns.
Peak simultaneous connections. Use for infra scaling & capacity alerts.
Overlap diagrams show multi-feature adoption (Chat / Social / Video). Higher overlap correlates with improved retention.
Month-to-date stacked chart of authenticated users. The "Overused visitors" segment shows visitors who crossed the monthly fair-use threshold and were folded into the signed-in count for billing. Watch the slope for post-release or campaign impact.
Month-to-date count of anonymous visitors tracked by device ID. Compare against the "Overused visitors" segment in Signed-in MAUs to see how much visitor traffic is converting into billable usage.
## Interpreting Feature Overlap
Users engaging in multiple modalities (e.g., Chat + Video) typically have higher lifetime value.
If one feature shows low overlap, embed contextual entry points or cross-prompts.
## Understanding Visitor Traffic & Fair-Use Classification
Visitors are anonymous, unauthenticated users browsing your community without signing in. To keep platform costs aligned with actual resource usage, visitor activity is tracked and classified into the following buckets:
An anonymous visitor (identified by device ID) who stays within the monthly fair-use threshold. Billed at the standard, lower visitor rate.
A visitor who exceeds the monthly fair-use threshold of API requests. Once reclassified, they're removed from the Visitor MAU count and added to the Signed-in MAU count for billing — they're never counted in both buckets at once.
When a visitor reaches the daily request limit, they're shown a sign-in prompt encouraging them to register. This nudge persists until the daily limit resets, gently converting frequent visitors into registered members.
Overused Visitor MAU figures refresh daily. Because reclassification moves a visitor out of the Visitor MAU bucket entirely, your Visitor MAU and Overused Visitor MAU counts always reconcile without double-counting.
## Historical Trends
Adjust date selector (e.g., last 30 / 90 days).
Identify recurring daily/weekly peaks; align scaling schedule.
Review active, churned (inactive), resource consumption (video minutes, storage), and the Visitor MAU / Overused Visitor MAU columns for billing reconciliation.
Look for divergence between active growth and returning stability (possible shallow engagement), or a rising share of Overused Visitor MAUs (possible scraping or heavy anonymous usage).
## Core Metrics Definitions
| Metric | Definition | Use Case | Watch For |
| ------------------------------- | ----------------------------------------------------------------------------------------- | ---------------------------- | ------------------------------------- |
| New Users | Accounts created in period | Acquisition tracking | Spikes without retention lift |
| Returning Users | Previously active & active again | Stickiness / engagement | Declining ratio vs total active |
| Inactive Users | Previously active; no activity now | Churn monitoring | Uptrend across consecutive periods |
| Concurrent Connections (Peak) | Max simultaneous connections | Capacity planning | Peak nearing infra limit |
| MAU MTD | Unique users active month-to-date | Month pacing | Flattening mid-month slope |
| Visitor MAU | Anonymous, unauthenticated users (by device ID) within the monthly fair-use threshold | Public traffic & SEO reach | Large gap vs. signed-in growth |
| Overused Visitor MAU | Visitors who exceeded the monthly fair-use threshold and are billed at the signed-in rate | Cost & conversion monitoring | Rising share of total visitor traffic |
| Feature Overlap % | Users using multiple core features | Adoption depth | Low overlap vs benchmarks |
| Video Watch Minutes (FHD/HD/SD) | Minutes consumed by quality tier | Bandwidth & cost mgmt | Disproportionate FHD spike |
| File Storage | Total storage consumed | Cost forecasting | Sudden growth (unoptimized media) |
## Leading Indicators & Actions
Inactive users rising week over week. Action: trigger lifecycle emails, in-app nudges.
Concurrent peak >80% of provisioned. Action: scale infra / implement rate smoothing.
Low Chat+Video overlap. Action: add contextual share/join prompts in video surfaces.
File storage slope acceleration. Action: implement media retention policy / compression.
FHD minutes ratio jumps. Action: validate encoding defaults & user network conditions.
Overused Visitor MAU share climbing relative to total Visitor MAU. Action: review whether traffic reflects genuine engagement (consider conversion prompts) or scraping/bot activity (contact support to review network-level limits).
## Dashboards Operating Cadence
Check new vs returning, concurrency anomalies, and Overused Visitor MAU movement (this figure refreshes daily).
Trend inactive, overlap %, video quality distribution.
Cohort retention, capacity headroom, cost drivers.
Benchmark adoption vs product roadmap targets.
## Troubleshooting
| Symptom | Possible Cause | Resolution |
| ---------------------------------------- | ------------------------------------- | ------------------------------------------------ |
| New Users spike; returning flat | Low first-week activation | Improve onboarding sequence & feature discovery |
| Concurrency plateau while new users grow | Session clustering / timezone pattern | Rebalance infra schedule; analyze session length |
| Inactive surge after release | Regression or UX friction | Review release telemetry & session error logs |
| Video minutes drop, storage rising | Incomplete uploads accumulating | Implement cleanup of failed uploads |
| FHD minutes sudden spike | Default quality forced high | Re-enable adaptive bitrate / CDN config check |
## Related
Granular export tooling
Behavioral deep dive
Need additional custom metrics? Contact support to discuss extended analytics or data export options.
Track new user inflow
Monitor returning vs inactive
Peak load insights
Cross‑usage patterns
Usage for each module
Identify inactivity early
Track visitor traffic and fair-use reclassification
## KPI Overview (Main View)
Users created in selected period. % delta compares to prior equivalent period. Sudden spikes: evaluate campaign attribution; drops: audit funnel.
Active this period AND prior period. Proxy for retention & stickiness. Track ratio returning / total active.
Previously active but not active this period. Rising trend → trigger re‑engagement campaigns.
Peak simultaneous connections. Use for infra scaling & capacity alerts.
Overlap diagrams show multi-feature adoption (Chat / Social / Video). Higher overlap correlates with improved retention.
Month-to-date stacked chart of authenticated users. The "Overused visitors" segment shows visitors who crossed the monthly fair-use threshold and were folded into the signed-in count for billing. Watch the slope for post-release or campaign impact.
Month-to-date count of anonymous visitors tracked by device ID. Compare against the "Overused visitors" segment in Signed-in MAUs to see how much visitor traffic is converting into billable usage.
## Interpreting Feature Overlap
Users engaging in multiple modalities (e.g., Chat + Video) typically have higher lifetime value.
If one feature shows low overlap, embed contextual entry points or cross-prompts.
## Understanding Visitor Traffic & Fair-Use Classification
Visitors are anonymous, unauthenticated users browsing your community without signing in. To keep platform costs aligned with actual resource usage, visitor activity is tracked and classified into the following buckets:
An anonymous visitor (identified by device ID) who stays within the monthly fair-use threshold. Billed at the standard, lower visitor rate.
A visitor who exceeds the monthly fair-use threshold of API requests. Once reclassified, they're removed from the Visitor MAU count and added to the Signed-in MAU count for billing — they're never counted in both buckets at once.
When a visitor reaches the daily request limit, they're shown a sign-in prompt encouraging them to register. This nudge persists until the daily limit resets, gently converting frequent visitors into registered members.
Overused Visitor MAU figures refresh daily. Because reclassification moves a visitor out of the Visitor MAU bucket entirely, your Visitor MAU and Overused Visitor MAU counts always reconcile without double-counting.
## Historical Trends
Adjust date selector (e.g., last 30 / 90 days).
Identify recurring daily/weekly peaks; align scaling schedule.
Review active, churned (inactive), resource consumption (video minutes, storage), and the Visitor MAU / Overused Visitor MAU columns for billing reconciliation.
Look for divergence between active growth and returning stability (possible shallow engagement), or a rising share of Overused Visitor MAUs (possible scraping or heavy anonymous usage).
## Core Metrics Definitions
| Metric | Definition | Use Case | Watch For |
| ------------------------------- | ----------------------------------------------------------------------------------------- | ---------------------------- | ------------------------------------- |
| New Users | Accounts created in period | Acquisition tracking | Spikes without retention lift |
| Returning Users | Previously active & active again | Stickiness / engagement | Declining ratio vs total active |
| Inactive Users | Previously active; no activity now | Churn monitoring | Uptrend across consecutive periods |
| Concurrent Connections (Peak) | Max simultaneous connections | Capacity planning | Peak nearing infra limit |
| MAU MTD | Unique users active month-to-date | Month pacing | Flattening mid-month slope |
| Visitor MAU | Anonymous, unauthenticated users (by device ID) within the monthly fair-use threshold | Public traffic & SEO reach | Large gap vs. signed-in growth |
| Overused Visitor MAU | Visitors who exceeded the monthly fair-use threshold and are billed at the signed-in rate | Cost & conversion monitoring | Rising share of total visitor traffic |
| Feature Overlap % | Users using multiple core features | Adoption depth | Low overlap vs benchmarks |
| Video Watch Minutes (FHD/HD/SD) | Minutes consumed by quality tier | Bandwidth & cost mgmt | Disproportionate FHD spike |
| File Storage | Total storage consumed | Cost forecasting | Sudden growth (unoptimized media) |
## Leading Indicators & Actions
Inactive users rising week over week. Action: trigger lifecycle emails, in-app nudges.
Concurrent peak >80% of provisioned. Action: scale infra / implement rate smoothing.
Low Chat+Video overlap. Action: add contextual share/join prompts in video surfaces.
File storage slope acceleration. Action: implement media retention policy / compression.
FHD minutes ratio jumps. Action: validate encoding defaults & user network conditions.
Overused Visitor MAU share climbing relative to total Visitor MAU. Action: review whether traffic reflects genuine engagement (consider conversion prompts) or scraping/bot activity (contact support to review network-level limits).
## Dashboards Operating Cadence
Check new vs returning, concurrency anomalies, and Overused Visitor MAU movement (this figure refreshes daily).
Trend inactive, overlap %, video quality distribution.
Cohort retention, capacity headroom, cost drivers.
Benchmark adoption vs product roadmap targets.
## Troubleshooting
| Symptom | Possible Cause | Resolution |
| ---------------------------------------- | ------------------------------------- | ------------------------------------------------ |
| New Users spike; returning flat | Low first-week activation | Improve onboarding sequence & feature discovery |
| Concurrency plateau while new users grow | Session clustering / timezone pattern | Rebalance infra schedule; analyze session length |
| Inactive surge after release | Regression or UX friction | Review release telemetry & session error logs |
| Video minutes drop, storage rising | Incomplete uploads accumulating | Implement cleanup of failed uploads |
| FHD minutes sudden spike | Default quality forced high | Re-enable adaptive bitrate / CDN config check |
## Related
Granular export tooling
Behavioral deep dive
Need additional custom metrics? Contact support to discuss extended analytics or data export options.